
The primary goal of this Virtual Training Project (VTP) is to use the Linux and R programming languages to bioinformatically characterize, quantify and visualize the species composition of urban microbiome samples (i.e. subway swabs) from raw data to completed analysis.
What is bioinformatics
Why is the metagenomics application of bioinformatics useful?
In case you are thinking, "How would someone be able to use this knowledge in real life?", here are three real-world applications of the metagenomics analysis technique you will learn:
Research Applications: you can ask questions about the similarity
of microbiome samples, the prevalence/emergence of antimicrobial
resistant strains, etc. The MetaSUB Project, which is where the data
you'll analyze in this VTP comes from, would be an example of this
application.
Clinical Applications: This technique is already being employed by
some biotech startups, like Karius, to
rapidly diagnose blood-borne infections.
Biotech/Industry Applications: Some companies offer microbial
surveillance services to identify and monitor the presence of
resistant pathogens (e.g. on hospital surfaces). One such startup
called Biotia was spun out of the Mason
lab (the same Cornell Med lab that created the MetaSUB project) and
utilizes many of the same techniques that you will employ in this
VTP."
In a broader sense, bioinformatics is a subdivision of data science; principles learned in the former are highly relevant to the latter. We'll point these out as we go along.
The source of the data you will analyze in this VTP is from the MetaSUB Project, an effort to characterize the "built environment" microbiomes of mass transit systems around the world, headed by Dr. Chris Mason's Lab at Weill Cornell Medical Center.
MetaSUB an international consortium of laboratories created to establish a world-wide "DNA map" of microbiomes in mass transit systems. It is succeeded a previous study
MetaSUB consists of a group of labs from all over the world working together to study the microbes in mass transit systems like bacteria, viruses, and archaea (i.e. their microbiomes) and make a "DNA map" of sequences from them. The project was started by the Mason lab and is an extension of a previous study called Pathomap. Pathomap only looked at the NYC subway system and aimed to create a profile of what's normal, identify potential bio-threats, and use the data to make the city better for people's health. MetaSUB recognized that other cities around the world could benefit from a similar study and decided to expand the project to include subway systems worldwide.
Take a look at this figure, which provides an overview of MetaSUB's design and execution:
As you can see, the researchers collected samples from
(A) New York City's five boroughs
(B) Collected samples from the 466 subway stations of NYC across the 24 subway lines
(C) extracted, sequenced, QC'd and analyzed DNA
(D) Mapped the distribution of taxa identified from the entire pooled dataset, and
(E) presented geospatial analysis of a highly prominent genus, Pseudomonas
Notably, as seen in (D), nearly half of the DNA sequenced (48%) did not match any known organism, underscoring the vast wealth of likely unknown organisms that surround passengers every day.
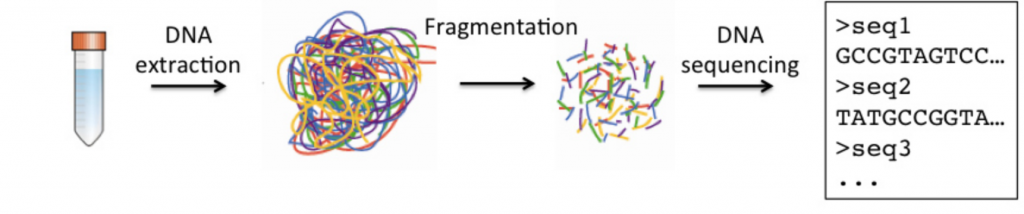
Now, let's focus on Fig 1C, this is shows at a high level the steps to process and analyze samples. We'll be doing a very similar analysis in this VTP but not identical.
Here's a simplified version of sample processing and sequencing:
Alright, before moving onto the next section, here are some more resources in case you want to review them later:
Here's the MetaSUB paper in case you would like to review it later. To be frank, this article is a bit challenging to read, so we suggest you review it later on if you're inclined, after you've done a bit of the VTP.
New York Times article about the MetaSUB Project.
Here's the Pathomap paper, the predecessor study that only investigated the NYC Subway Microbiome.
Throughout this VTP, you will characterize, quantify and visualize microbial metagenomics data from sequenced swabs of public urban environments on your own cloud-hosted High Performance Compute Instance.
In the Linux terminal, you will learn the structure of raw genomic data and perform taxonomic characterization & abundance quantification. In R, you will determine the mose abundant species in your sample and visualize results at several taxonomic levels.
Here's a flowchart of the analysis you'll perform:
All bioinformatics tasks will be performed in "the cloud" on your own Amazon Web Services (AWS) hosted high performance compute instance.
What is cloud computing:
For this project, you will execute all Linux and R tasks in RStudio.
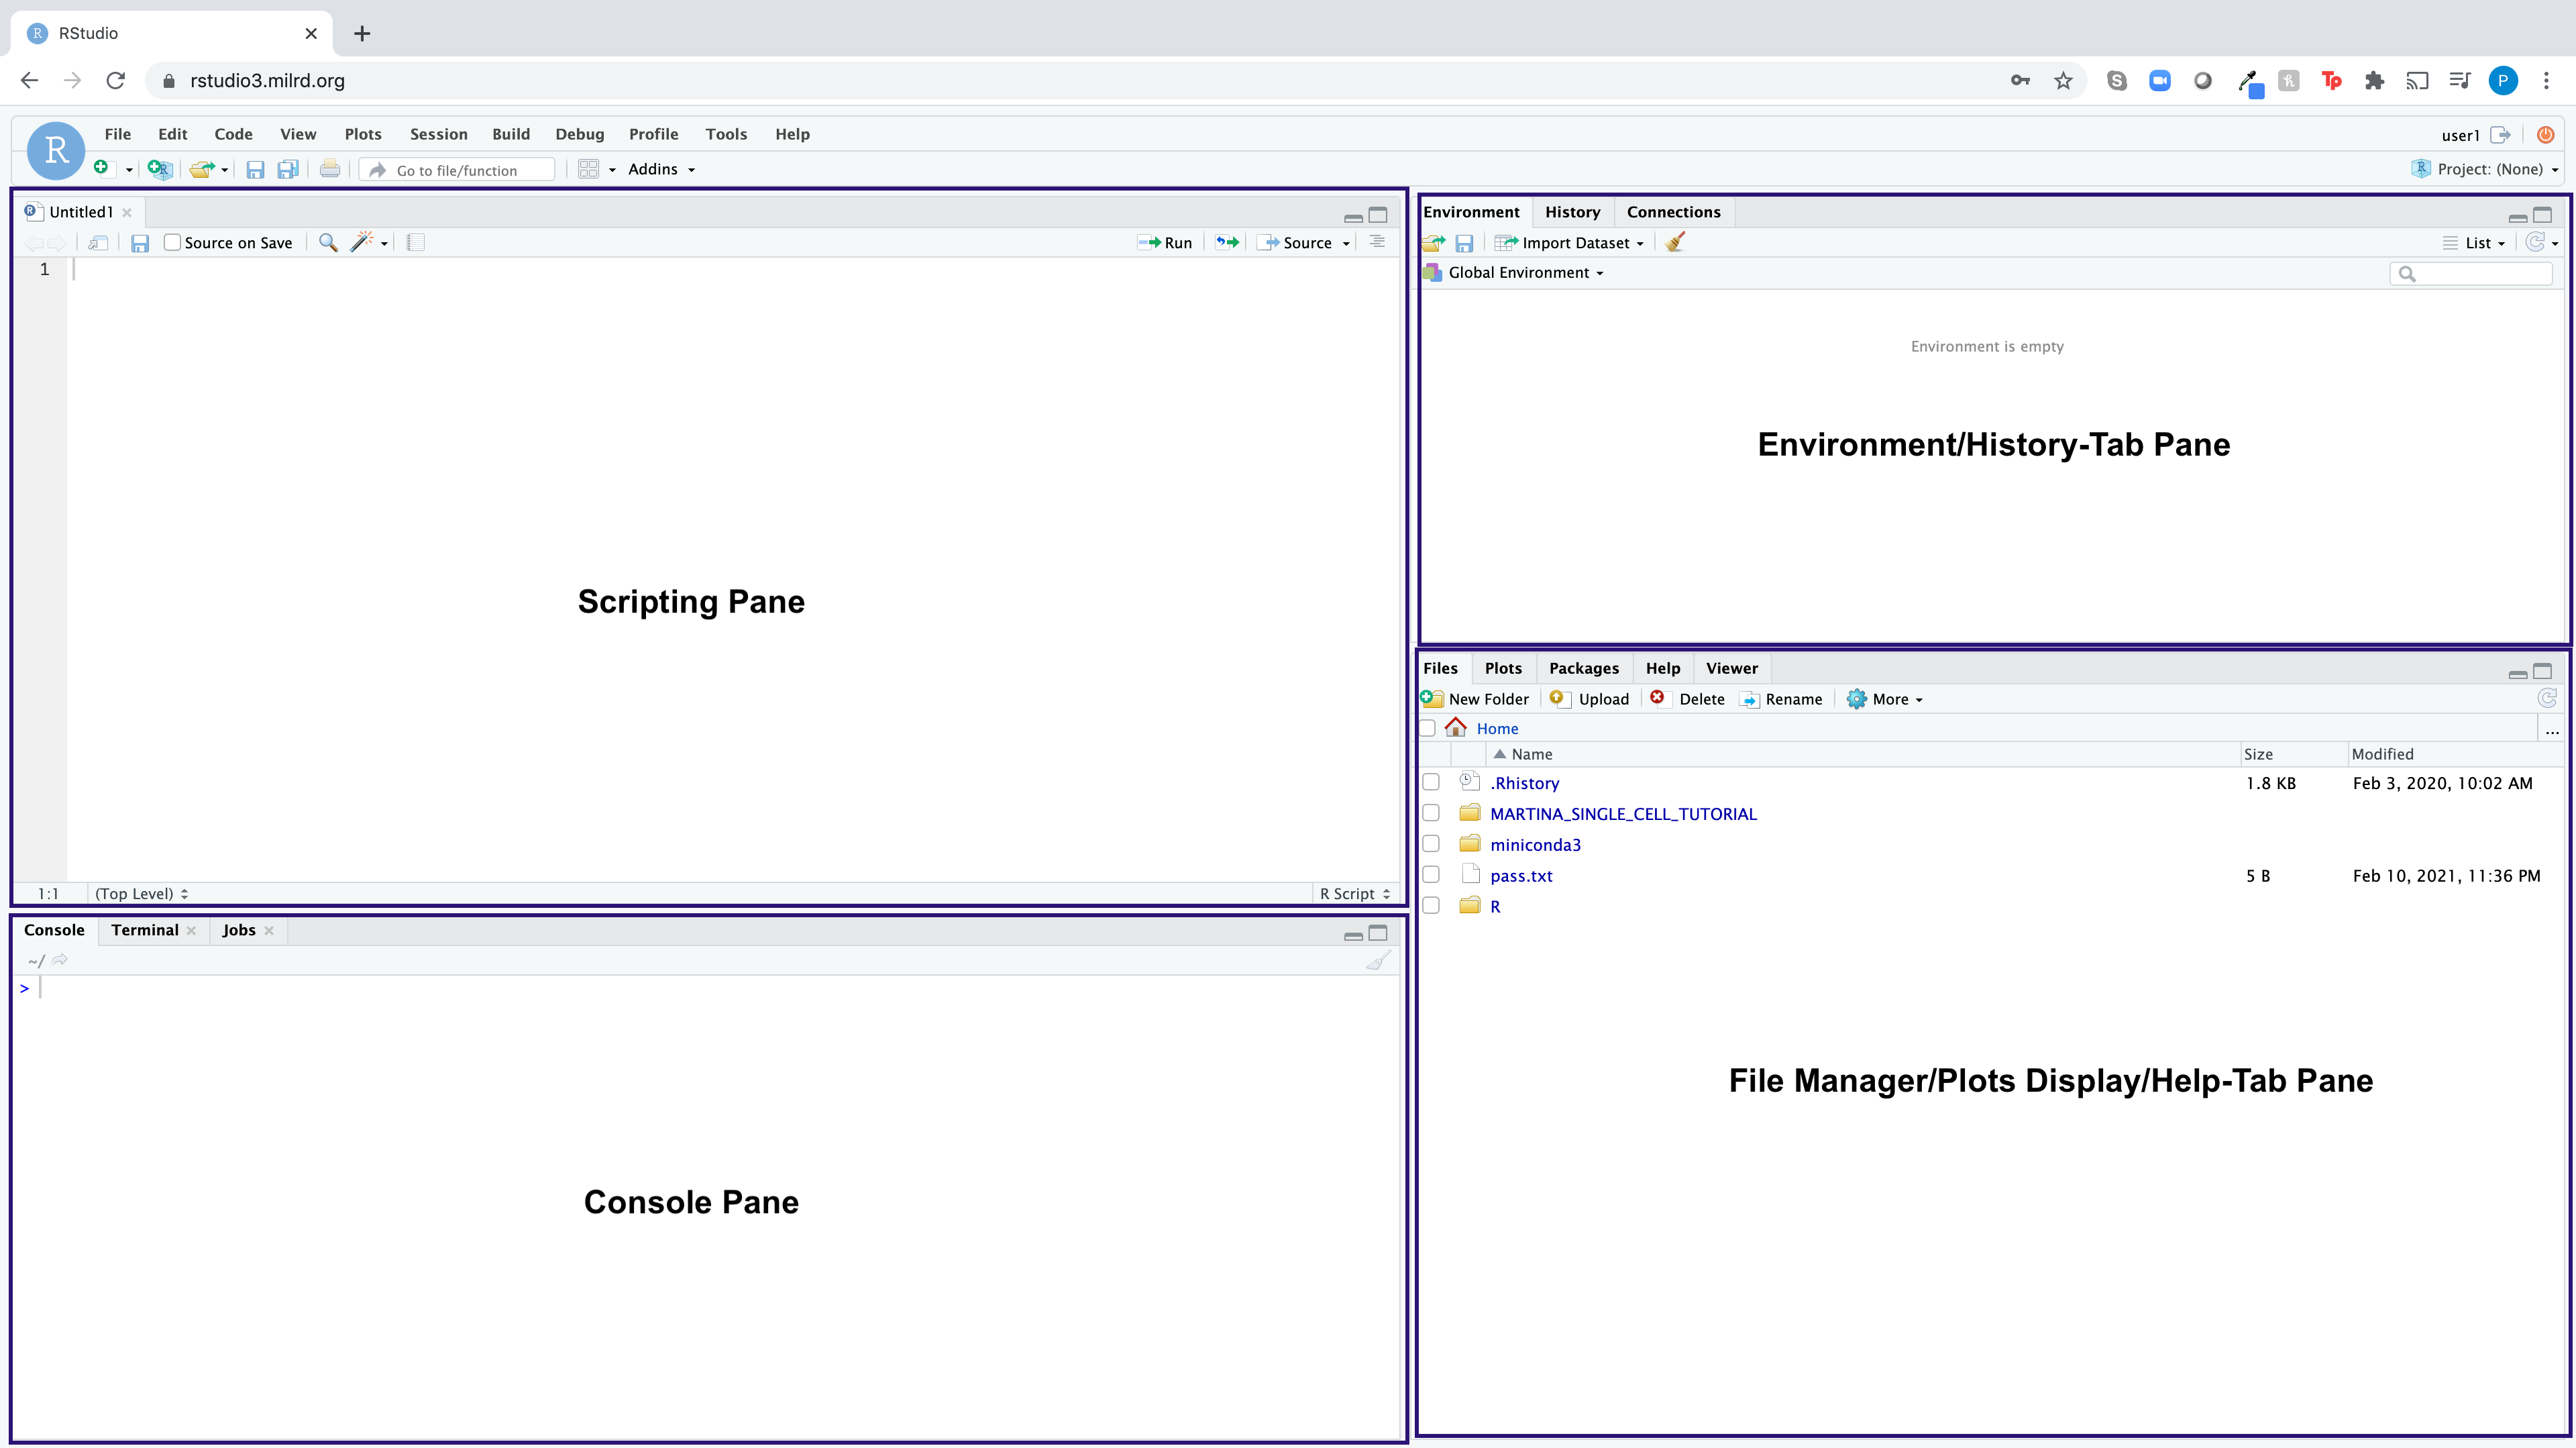
RStudio is an integrated development environment (IDE) for the open-source R programming language, which basically means it brings the core components of R (Scripting Pane, Console, Environment Pane, File Manager/Plots/Help Pane) into a quadrant-based user interface for efficient use.
RStudio also comes with a Linux terminal built-in, where you can execute linux commands.
Access your Linux terminal by logging into RStudio via the web browser
(can be found in the the Getting Started section.
Here is what the RStudio dashboard looks like:
See One, Do One, Repeat: In each step of this analysis, you will first see the analysis performed with Example Sample [sname_1]([sid_1]). You will be asked to reproduce the step with that same sample and confirm you get the same results. You will then be asked to execute the step with your own assigned sample, which is found in the Getting Started section.
Do not get hung up on coding syntax: our goal is not to teach you a programming language or languages from scratch. Our goal is for you to understand the inputs, parameters, outputs, and how to interpret the output. Some participants find it helpful to think of each step as a mathematical function (e.g. y = mx + b): regardless of how complicated a block of code or command is, you are always putting data in and getting data out.